
The living heart of the network: the thematic groups and the research experiences of the different schools of Italian social statistics — research themes, methodological perspectives, case studies.
Thematic groups
To begin with, we present the thematic groups led by the network’s coordinators. Open a profile to read it. Each profile follows the same structure (themes and methods; publications, tools and initiatives; links), so that other groups can be added in a comparable way: to propose one, write to info [at] statisticasociale [dot] it.
Futures Studies: statistical and data-driven approaches to the futureLead: Simone Di Zio (“G. d’Annunzio” University of Chieti-Pescara)Statistical rigour in futures studies: expert judgement, scenarios and public decisions under uncertainty.Read more
The group brings statistical rigour to futures studies: methods to collect expert judgement and make it converge, build scenarios and support public decisions under uncertainty. A distinctive feature is the spatial dimension: variants of the Delphi method that work directly on the territory, for example to identify where to locate a service or where a risk is most likely.
Themes and methods
- The Delphi method and its variants: Spatial Delphi, Spatial Shang, Real-Time Spatial Delphi
- Scenario building and data-driven foresight
- Spatial statistics and GIS for the convergence of opinions on the territory
- Decision support and multi-criteria analysis (AHP combined with Delphi)
- Scenarios on crime and terrorism, criminological and forensic statistics
Publications, tools and initiatives
- Methodological papers in Technological Forecasting and Social Change and Futures (Spatial Delphi 2011, Spatial Shang 2014, Real-Time Spatial Delphi 2017, Delphi and AHP 2024)
- RT-GSCS, an open web platform for the Real-Time Spatial Delphi (2023)
- The Future SIS Group of the Italian Statistical Society, coordinated by Di Zio, and the SIS Summer School in Futures Studies: statistical and data-driven approaches
- The Italy Node of the Millennium Project, co-chaired by Di Zio, and the 2027 Cruise School on artificial intelligence for technological and social change
Further information: Future SIS Group · Millennium Project – Italy Node · RT-GSCS
Science mapping and quantitative analysis of the scientific literatureLead: Massimo Aria (University of Naples Federico II)Methods and software to study science with statistics: the structure and evolution of research fields.Read more
The group develops methods and software to study science with statistics: mapping the conceptual, intellectual and social structure of a research field, following its evolution over time and comparing different communities. The tools are open source and used by researchers in every discipline; the Atlas on this website applies them to social statistics.
Themes and methods
- Science mapping: co-citation analysis, keyword co-occurrence and collaboration networks
- Thematic evolution of research fields and bibliometric systematic literature reviews
- Comparative science mapping using metadata
- Collecting bibliographic data from open databases (OpenAlex, Dimensions, PubMed)
- Text and content analysis of scientific articles
Publications, tools and initiatives
- bibliometrix, an R package with the biblioshiny web interface (reference paper: Aria and Cuccurullo, Journal of Informetrics, 2017), downloaded more than one and a half million times from CRAN
- Other open-source R packages: openalexR, tall (Text Analysis for aLL), dimensionsR, pubmedR
- A Primer on Science Mapping Analysis with Biblioshiny (Aria and Cuccurullo, 2026)
- Summer School in Science Mapping (Naples, every year since 2023; 2027 edition 24–28 May)
- PRIN project SciK-Health on scientific production in health care (see the case study)
Further information: bibliometrix.org · Summer School in Science Mapping · code on GitHub
Statistics for transport and tourismLead: Massimo Aria (University of Naples Federico II)Statistics applied to mobility and tourism, together with transport engineers and tourism economists.Read more
The group applies statistics to two sectors that directly affect daily life and the development of territories: mobility and tourism. The research stems from collaboration with transport engineers and tourism economists and combines survey data, administrative data and experiments.
Themes and methods
- Road safety: data mining and tree-based methods for crash analysis, driving simulator experiments
- Transport demand and planning: railways after the pandemic, effects of new metro stations
- Citizens’ trust in transport and tourism development, with structural equation models
- Tourists’ travel behaviour and discrete choice models
- Competitiveness and governance of tourist destinations, cooperation and business networks
Publications, tools and initiatives
- Models and Applications of Tourists’ Travel Behavior (Pagliara, Aria, Mauriello, eds.; Elsevier, 2025)
- Papers in Tourism Management, Accident Analysis & Prevention, Transportation Research Record, Journal of Destination Marketing & Management
- Participation in the National Centre for Sustainable Mobility (MOST, Italian Recovery Plan)
Further information: Elsevier volume 2025 · MOST National Centre
Research experiences
Short case studies in a problem → method → result format, showing what social statistics does in practice.
 SciK-Health: what does research produce in university hospitals?Case study · Science mappingA dataset on the 49 Italian public university hospital centres from 2000 to 2024, indicators in five dimensions and two tools for citizens and decision-makers.
PRIN 2022 project (code 2022825Y5E) · University of Naples Federico II and University of Campania “Luigi Vanvitelli” · Principal investigator: Massimo Aria
The problem
In Academic Health Science Centres (AHSCs), patient care, teaching and research coexist: in Italy they are university hospitals and research hospitals (IRCCS). Their scientific output should translate into better care, but how much research do they produce, on which topics and with what impact? Answering requires making different sources comparable, and results readable by citizens, professionals and decision-makers.
The method

The project builds a longitudinal dataset on the 49 public centres, from 2000 to 2024: about 229,000 scientific publications and 15,800 clinical trials, together with competitive funding, patents, datasets and online attention (sources: OpenAlex, Dimensions, Altmetric). The centres follow three organisational models: IRCCS research hospitals (23), university hospitals (17) and hospitals integrated with the national health service (9). On this basis:
- science mapping of the conceptual and social structure of research: topics, collaborations, change over time;
- indicators in five dimensions: bibliometric, social and digital, industrial impact and innovation, clinical research, funding;
- a composite score summarising the five dimensions;
- validation with stakeholders: focus groups with three university hospitals, one research hospital and a regional health agency.
The result
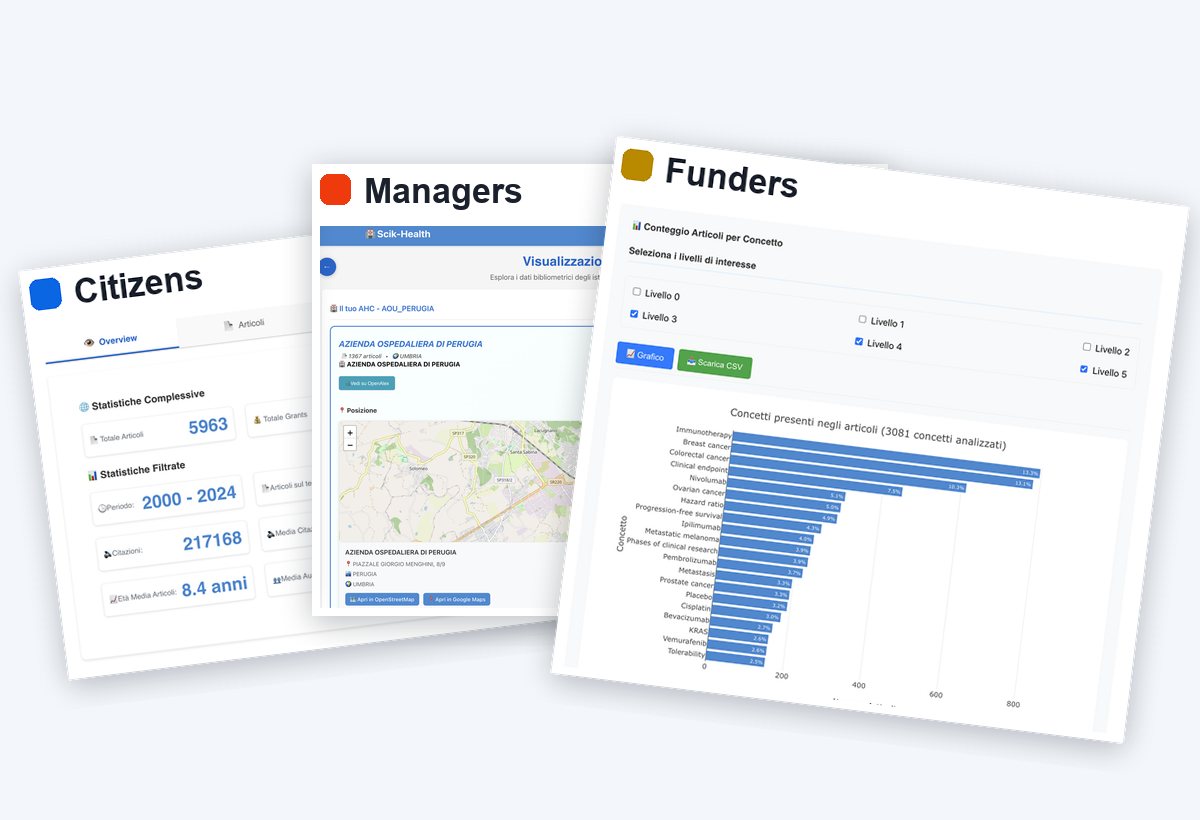
A web app makes more than 25 years of the centres’ scientific output searchable in a single query, with three perspectives and profile-based access: citizens find centres, experts and studies by disease; managers follow researchers’ productivity, impact and talent; funders assess grants, patents, clinical trials and online attention. For managers and funders, the composite R-daisy indicator summarises the five dimensions in a “daisy” profile. The case shows how methods developed to study science become tools for transparency and for supporting public decisions in health care.
Further information: SciK-Health project website
 Can dogs smell our emotions?Case study · Experimental design and multivariate analysisAn experiment with 40 dogs shows that the smell of human fear and happiness changes their behaviour and heart rate.
D’Aniello, Semin, Alterisio, Aria, Scandurra, Animal Cognition, 2018 · University of Naples Federico II (Departments of Biology and of Economics and Statistics) and ISPA – Instituto Universitário, Lisbon
The problem
“If you are afraid, the dog will notice”: people often say so, but is it true? When we feel fear or happiness, the body releases chemical signals through sweat. The question was whether these signals are enough to pass an emotion from one species to another, from humans to dogs, and how to show it with data rather than anecdotes.
The method

A controlled experiment, with the choices typical of a sound statistical design:
- odours collected from the sweat of donors watching videos that induced fear or happiness, pooling the samples of several people to neutralise individual differences;
- 40 pet dogs (31 Labradors and 9 Golden retrievers) assigned at random to three conditions: fear odour (15), happiness odour (15) and an odourless control (10);
- two-minute trials in a room with the owner and a stranger, both unaware of the condition (“blind”), with video recording and a heart rate monitor;
- behaviours towards the owner, towards the stranger and stress signals coded every 5 seconds, together with heart rate;
- linear discriminant analysis to see whether the odour can be recognised from the data, smoothing curves for the trend over time, ANOVA and Kruskal–Wallis tests for the comparisons.
The result

Yes, dogs “sense” our emotions. With the fear odour, dogs showed more stress signals and a higher heart rate; with the happiness odour, they sought their owner less and approached the stranger more. The discriminant analysis correctly assigns 87.5% of the observations to the odour condition they come from. Statistics was needed three times: to design the experiment properly, to collect comparable data and to measure how far the results support the hypothesis.
Further information: the article in Animal Cognition
 How do you slow cars down at intersections?Case study · Driving behaviour and experimental designHow do drivers behave near an intersection? In a simulator, 23 people and ten versions of the same road: driving styles compared to choose the safest treatment for a rural municipality.
Montella, Aria, D’Ambrosio, Galante, Mauriello, Pernetti, Accident Analysis and Prevention, 2011 · University of Naples Federico II (Departments of Transportation Engineering and of Mathematics and Statistics) and Second University of Naples
The problem

In a rural municipality the main road is a long straight and cars reach the intersections at more than 100 km/h, with a high risk of crashes. Road safety is first of all a matter of behaviour: speed is chosen by the driver, depending on how they perceive the road and the hazard, and not everyone reacts in the same way. Low-cost “perceptual” treatments (road markings, colours, narrowings) work precisely on this: change perception to change behaviour. The administration has to choose how to intervene on a limited budget. Which solution really changes the way people drive? And how can we know before opening the building site?
The method

An experiment on driver behaviour, run in the VERA driving simulator at the TEST laboratory in Naples (the cabin of a real car on a motion platform, in front of screens covering 180 degrees):
- 30 drivers drawn at random from those meeting the selection criteria, balanced by gender and age; 23 completed the test (the others suffered from simulator sickness);
- repeated measures: each driver went through all ten versions of the same stretch (a straight road without intersection, two untreated intersections and seven with treatments), so each person is compared with themselves; the order was counterbalanced across drivers to neutralise the habit effect;
- speed and lateral position recorded over the 500 metres before the intersection: 207 individual driving profiles in all;
- driving styles: each profile was classified, by similarity to theoretical profiles, into one of three ways of approaching the intersection: speeding up, braking late at a constant rate, or braking early and gradually;
- cluster analysis to find homogeneous groups of behaviour; analysis of variance for categorical data (CATANOVA, based on Gini’s heterogeneity index) to compare styles across versions; ANOVA and t tests for speed and lateral position.
The result
Without treatments, one driver in three speeds up when approaching the intersection (35%): the riskiest style. And the closer they get, the more behaviours diverge: the spread of speeds across drivers grows from 15 to 21 km/h. With perceptual treatments the driving style changes significantly: drivers who speed up fall to 9–22% and the cautious style, braking early and gradually, becomes prevalent (up to 83% with the raised island).
Dragon teeth markings (white triangles at the edges that optically narrow the lane), the colored intersection area and the raised median island also cut speed by 13–23 km/h from 250 metres before. The islands, however, by narrowing the lane, shift cars 40–60 cm towards the road edge. For the municipality the choice therefore falls on the colored intersection area with rumble strips: braking starts 330 metres earlier, speed at the centre of the intersection falls from 97 to 76 km/h, and cars stay in the middle of the lane. A low-cost treatment, chosen by observing how people drive before laying a single metre of asphalt.


Further information: the article in Accident Analysis and Prevention
More case studies will come with contributions from the network: to propose one, write to info [at] statisticasociale [dot] it.
Social indicators, well-being and quality of lifeLead: Filomena Maggino (Sapienza University of Rome)Measuring well-being and quality of life beyond GDP: from defining phenomena to indicator systems and their synthesis.Read more
The group studies how to measure well-being and quality of life beyond GDP: from the conceptual definition of phenomena to the construction of indicator systems, their synthesis and communication. This line of research gave rise in Italy to the BES project (Equitable and Sustainable Well-being), on whose scientific commission Maggino served from the start.
Themes and methods
Publications, tools and initiatives
Further information: AIQUAV · Encyclopedia of Quality of Life · Sapienza faculty page